Society and Economy Reopening Assessment (SERA) Tool
The SERA tool provides data, insight, and decision support on both reopening readiness assessment and post-reopening situational awareness. Out of the 38 metrics in four categories – COVID and public health, economic impact, mobility and social distancing, and vulnerable populations – currently included on our platform, more than 20 experts in epidemiology, public health, economics, transportation and mobility, and social sciences at the University of Maryland selected 16 metrics for inclusion in the SERA tool.
The SERA tool ranks each state and county and provides the percentile ranking for each metric that is of importance for reopening considerations, so decision makers and the public can see how their state or county compares to other states and counties in terms of the level of preparedness for reopening. In addition, the SERA tool shows how the reopening factors are changing in a state or county over time.
Reopening gating criteria and threshold values for certain SERA variables (e.g., testing capacity, days of decreasing COVID cases, contact tracing, hospital and ICU beds utilization) follow established guidelines from the World Health Organization and/or the U.S. federal government (e.g., White House, CDC). For SERA variables with threshold values, a state or county is not ready to reopen from the public health point of view if it does not pass the established gating criteria. If a state or county has decided to partially reopen despite not passing gating criteria, it has taken a public health risk due to other considerations and should still strive to pass the gating criteria by expanding hospital/ICU beds, increasing testing capacity, hiring more contact tracing workers and deploy contact tracing technology, and/or still emphasizing physical distancing after reopening.
For all but the “economic impact” category, a 20th or lower percentile means the state/county is in the top 20 percent in the country and is relatively more ready to reopen than the rest of the country based on that metric alone. An 80th or higher percentile indicates the state/county is in the bottom 20 percent in the nation and therefore relatively less ready to reopen based on that metric alone. Decision makers should pay special attention to metrics for which their state or county is ranked very low. For instance, a 90th percentile may indicate there is a large group of vulnerable populations who need to be supported, a higher number of imported cases due to out-of-state/county travel, and/or other specific improvement needs in healthcare system readiness or social distancing.
For metrics in the “economic impact” category, a low percentile (e.g., <20%) implies that the economy in a state or county is doing relative better than the rest of the country. While the University of Maryland team does not recommend using economic impact metrics values as justification for reopening or not reopening, we believe in the value for decision makers to be aware of the economic conditions in their state and county with more timely data that we provide on this platform.
The data sources for all metrics are summarized in the About page, including metrics that are originally computed by the Maryland Transportation Institute team. The SERA tool is currently updated weekly for all states and counties, while some individual metrics are updated daily. Our team will also soon provide detailed economic impact estimates (i.e., job loss or gain) by economic sector at the county level across the nation.
Mobility Metrics and Social Distancing Index
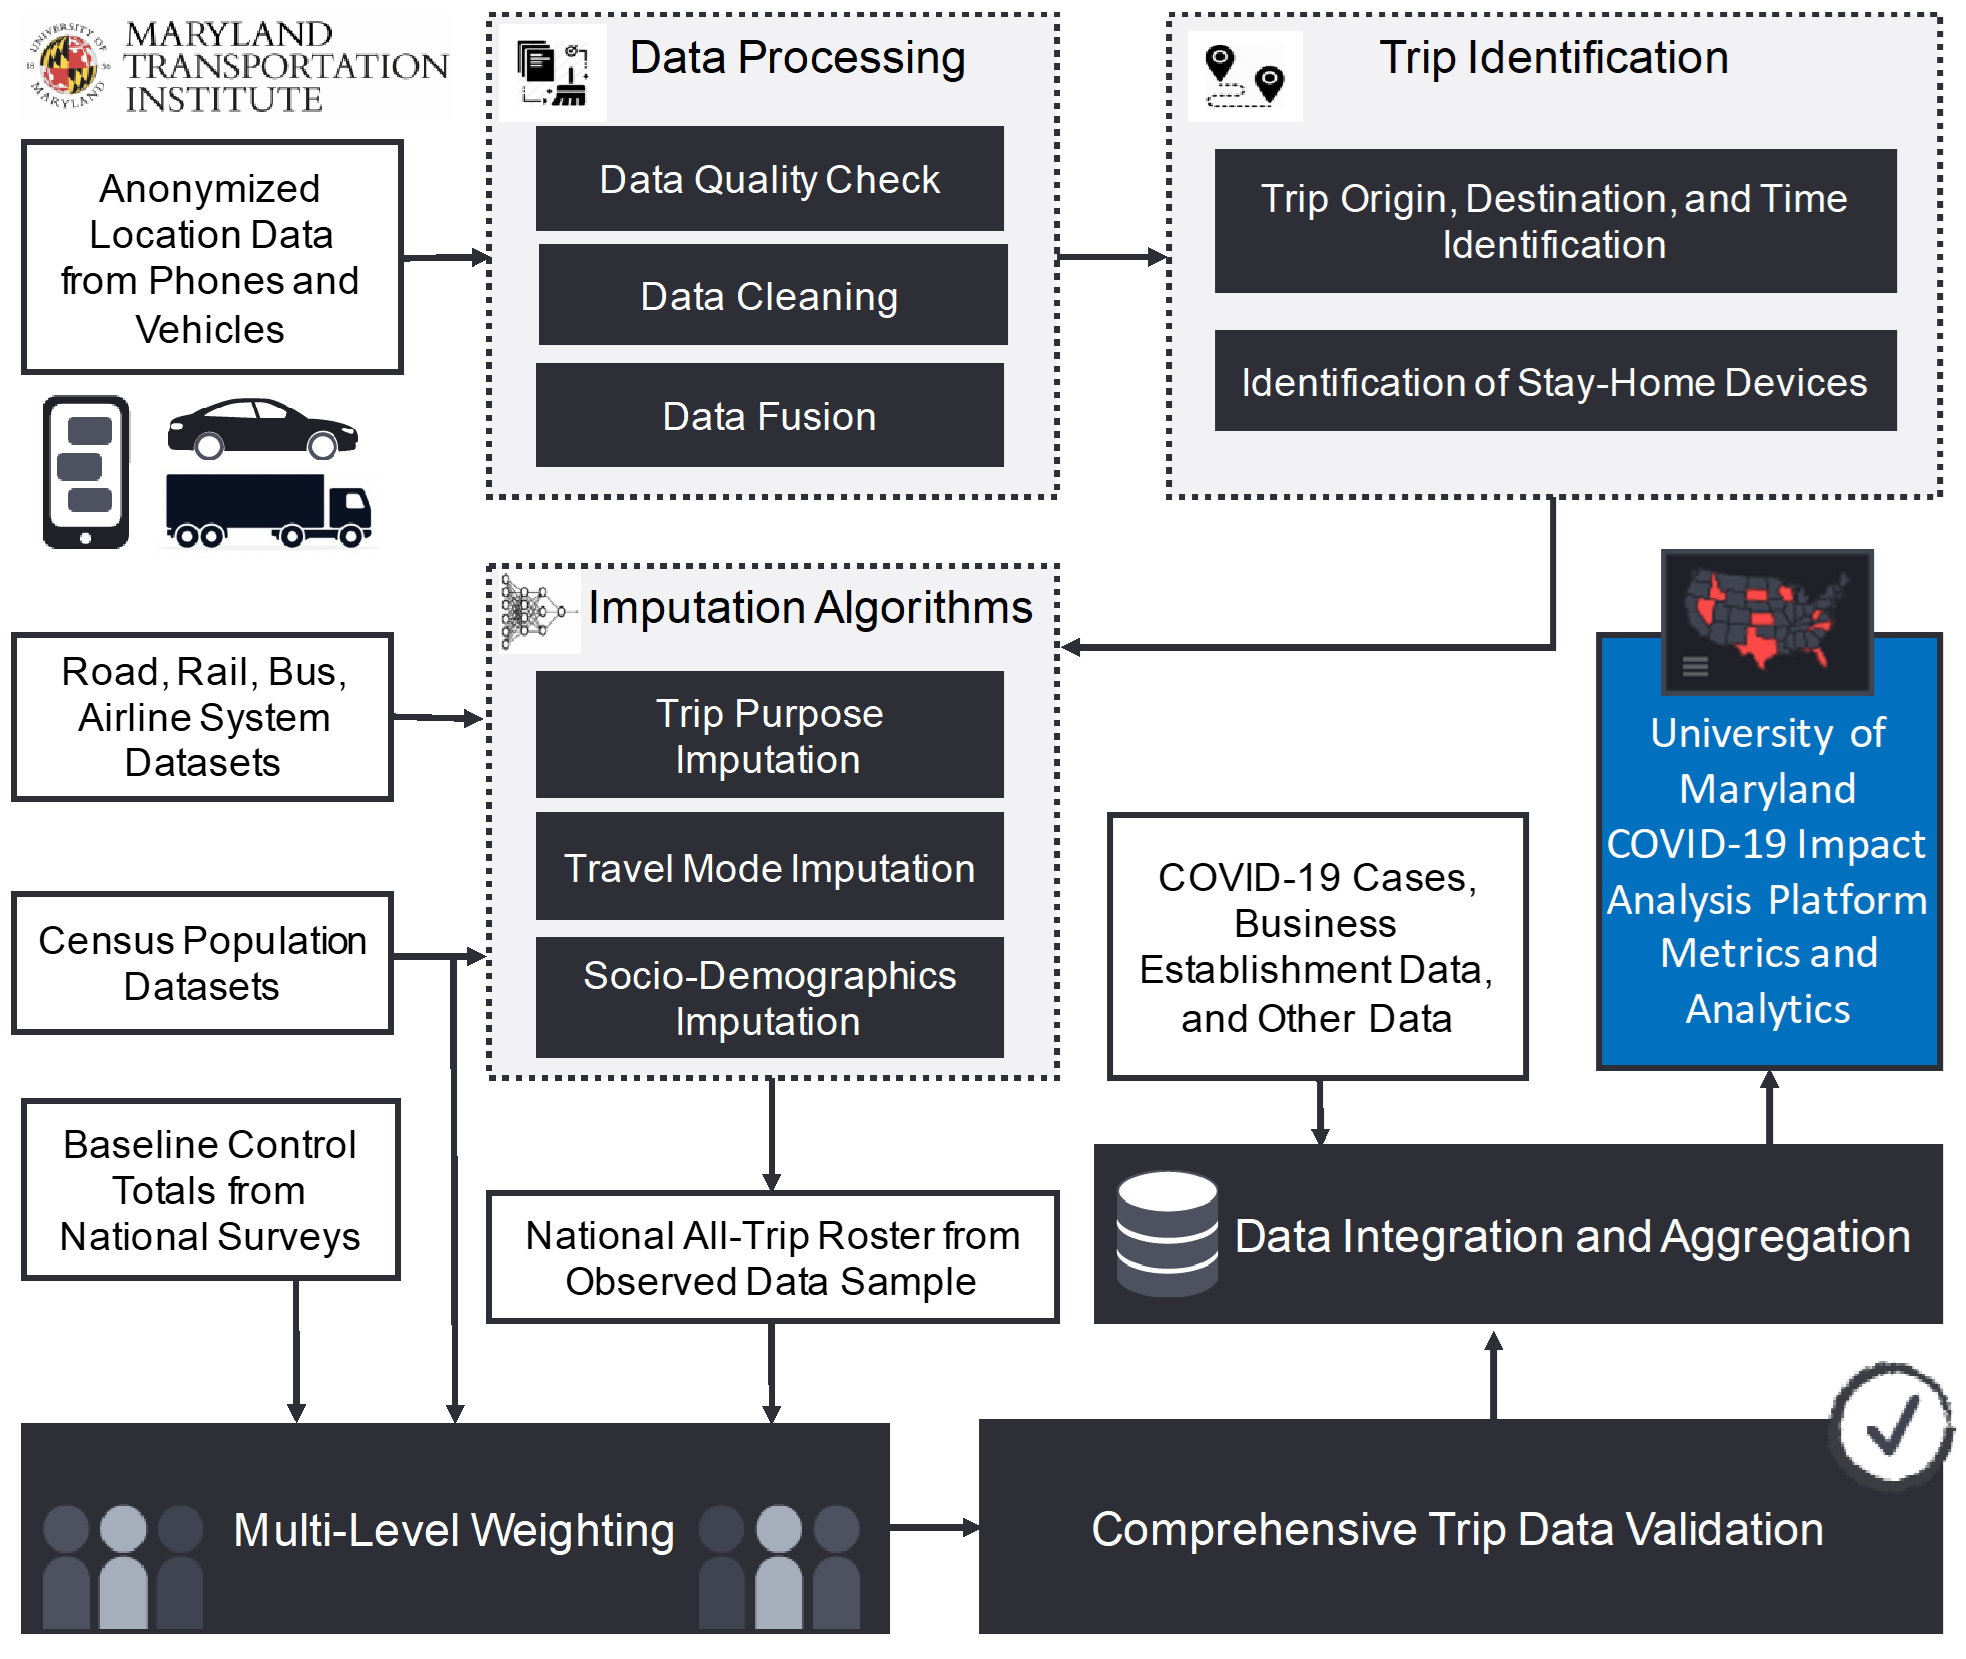
The project team first integrated and cleaned location data from multiple sources representing person and vehicle movements in order to improve the quality of our mobile device location data panel. We then applied previously developed and validated algorithms to identify all trips from the cleaned data panel, including trip origin, destination, departure time, and arrival time. Additional steps were taken to impute missing trip information for each trip, such as trip purpose (e.g., work, non-work), point-of-interest visited (restaurants, shops, etc.), travel mode (air, rail, bus, driving, biking, walking, and others), trip distance (airline and actual distance), and socio-demographics of the travelers (income, age, gender, race, etc.). If an anonymized individual in the sample did not make any trip with one trip end more than one mile away from home location, this anonymized individual was considered as staying at home. A trip with both trip ends at home (e.g., jogging three miles) does not violate our staying-at-home criteria. A multi-level weighting procedure employing both device weights and trip weights expanded the sample, so the results are representative of the entire population in a nation, state, or county. The data sources and computational algorithms have been validated based on a variety of independent datasets and peer reviewed by an external expert panel in a previous project funded by the U.S. Department of Transportation Federal Highway Administration’s Exploratory Advanced Research Program and titled “Data analytics and modeling methods for tracking and predicting origin-destination travel trends based on mobile device data.”
The social distancing index is computed from six mobility metrics by this equation: social distancing index = 0.8*[% staying home + 0.01*(100 - %staying home)*(0.1*% reduction of all trips compared to pre-COVID-19 benchmark + 0.2*% reduction of work trips + 0.4*% reduction of non-work trips + 0.3*% reduction of travel distance)] + 0.2*% reduction of out-of-county trips. The weights are chosen based on share of residents and visitor trips (e.g., about 20% of all trips are out-of-county trips, which led to the selection of a weight of 0.8 for resident trips and 0.2 for out-of-county trips); what trips are considered more essential (e.g., work trips more essential than non-work trips); and the principle that higher social distancing index scores should correspond to fewer chances for close-distance human interactions and virus transmissions.