This blog disseminates research findings from our team and partners to decision-makers, media and the general public in a timely fashion. The research work is driven by data and analytics in the COVID-19 Impact Analysis Platform.
PLANNED FUTURE BLOGS
- Impact of COVID-19 on the employment and jobs by state, county and economic sector.
- Impact of COVID-19 on different socio-demographic groups by income, age, gender, race and ethnicity with emphasis on vulnerable populations.
- Impact of COVID-19 on working from home and commercial delivery to homes.
WORKING PAPERS AND PUBLICATIONS
- Zhang L, Ghader S, Pack ML, Xiong C, Darzi A, Yang M, Sun Q, Kabiri A, Hu S. An interactive COVID-19 mobility impact and social distancing analysis platform. medRxiv 2020; published online May 5, 2020. DOI: https://doi.org/10.1101/2020.04.29.20085472 (preprint).
- Lee M, Zhao J, Sun Q, Pan Y, Zhou W, Xiong C, Zhang L. Human mobility trends during the COVID-19 pandemic in the United States. arXiv 2020; published online May 4, 2020. http://arxiv.org/abs/2005.01215 (preprint).
- Ghader S, Zhao J, Lee M, Zhou W, Zhao G, Zhang L. Observed mobility behavior data reveal social distancing inertia. arXiv 2020; published online Apr 30, 2020. https://arxiv.org/abs/2004.14748 (preprint).
- Xiong C, Hu S, Yang M, Younes HN, Luo W, Ghader S, Zhang L. Data-driven modeling reveals the impact of stay-at-home orders on human mobility during the COVID-19 pandemic in the U.S. arXiv 2020; published online May 2, 2020. http://arxiv.org/abs/2005.00667 (preprint).
- Pan Y, Darzi A, Kabiri A, Zhao G, Luo W, Xiong C, Zhang L. Quantifying human mobility behavior changes in response to non-pharmaceutical interventions during the COVID-19 outbreak in the United States. arXiv 2020; published online May 4, 2020. http://arxiv.org/abs/2005.01224 (preprint).
MAY 7, 2020: SOCIETY AND ECONOMY REOPENING ASSESSMENT (SERA) TOOL FINDINGS
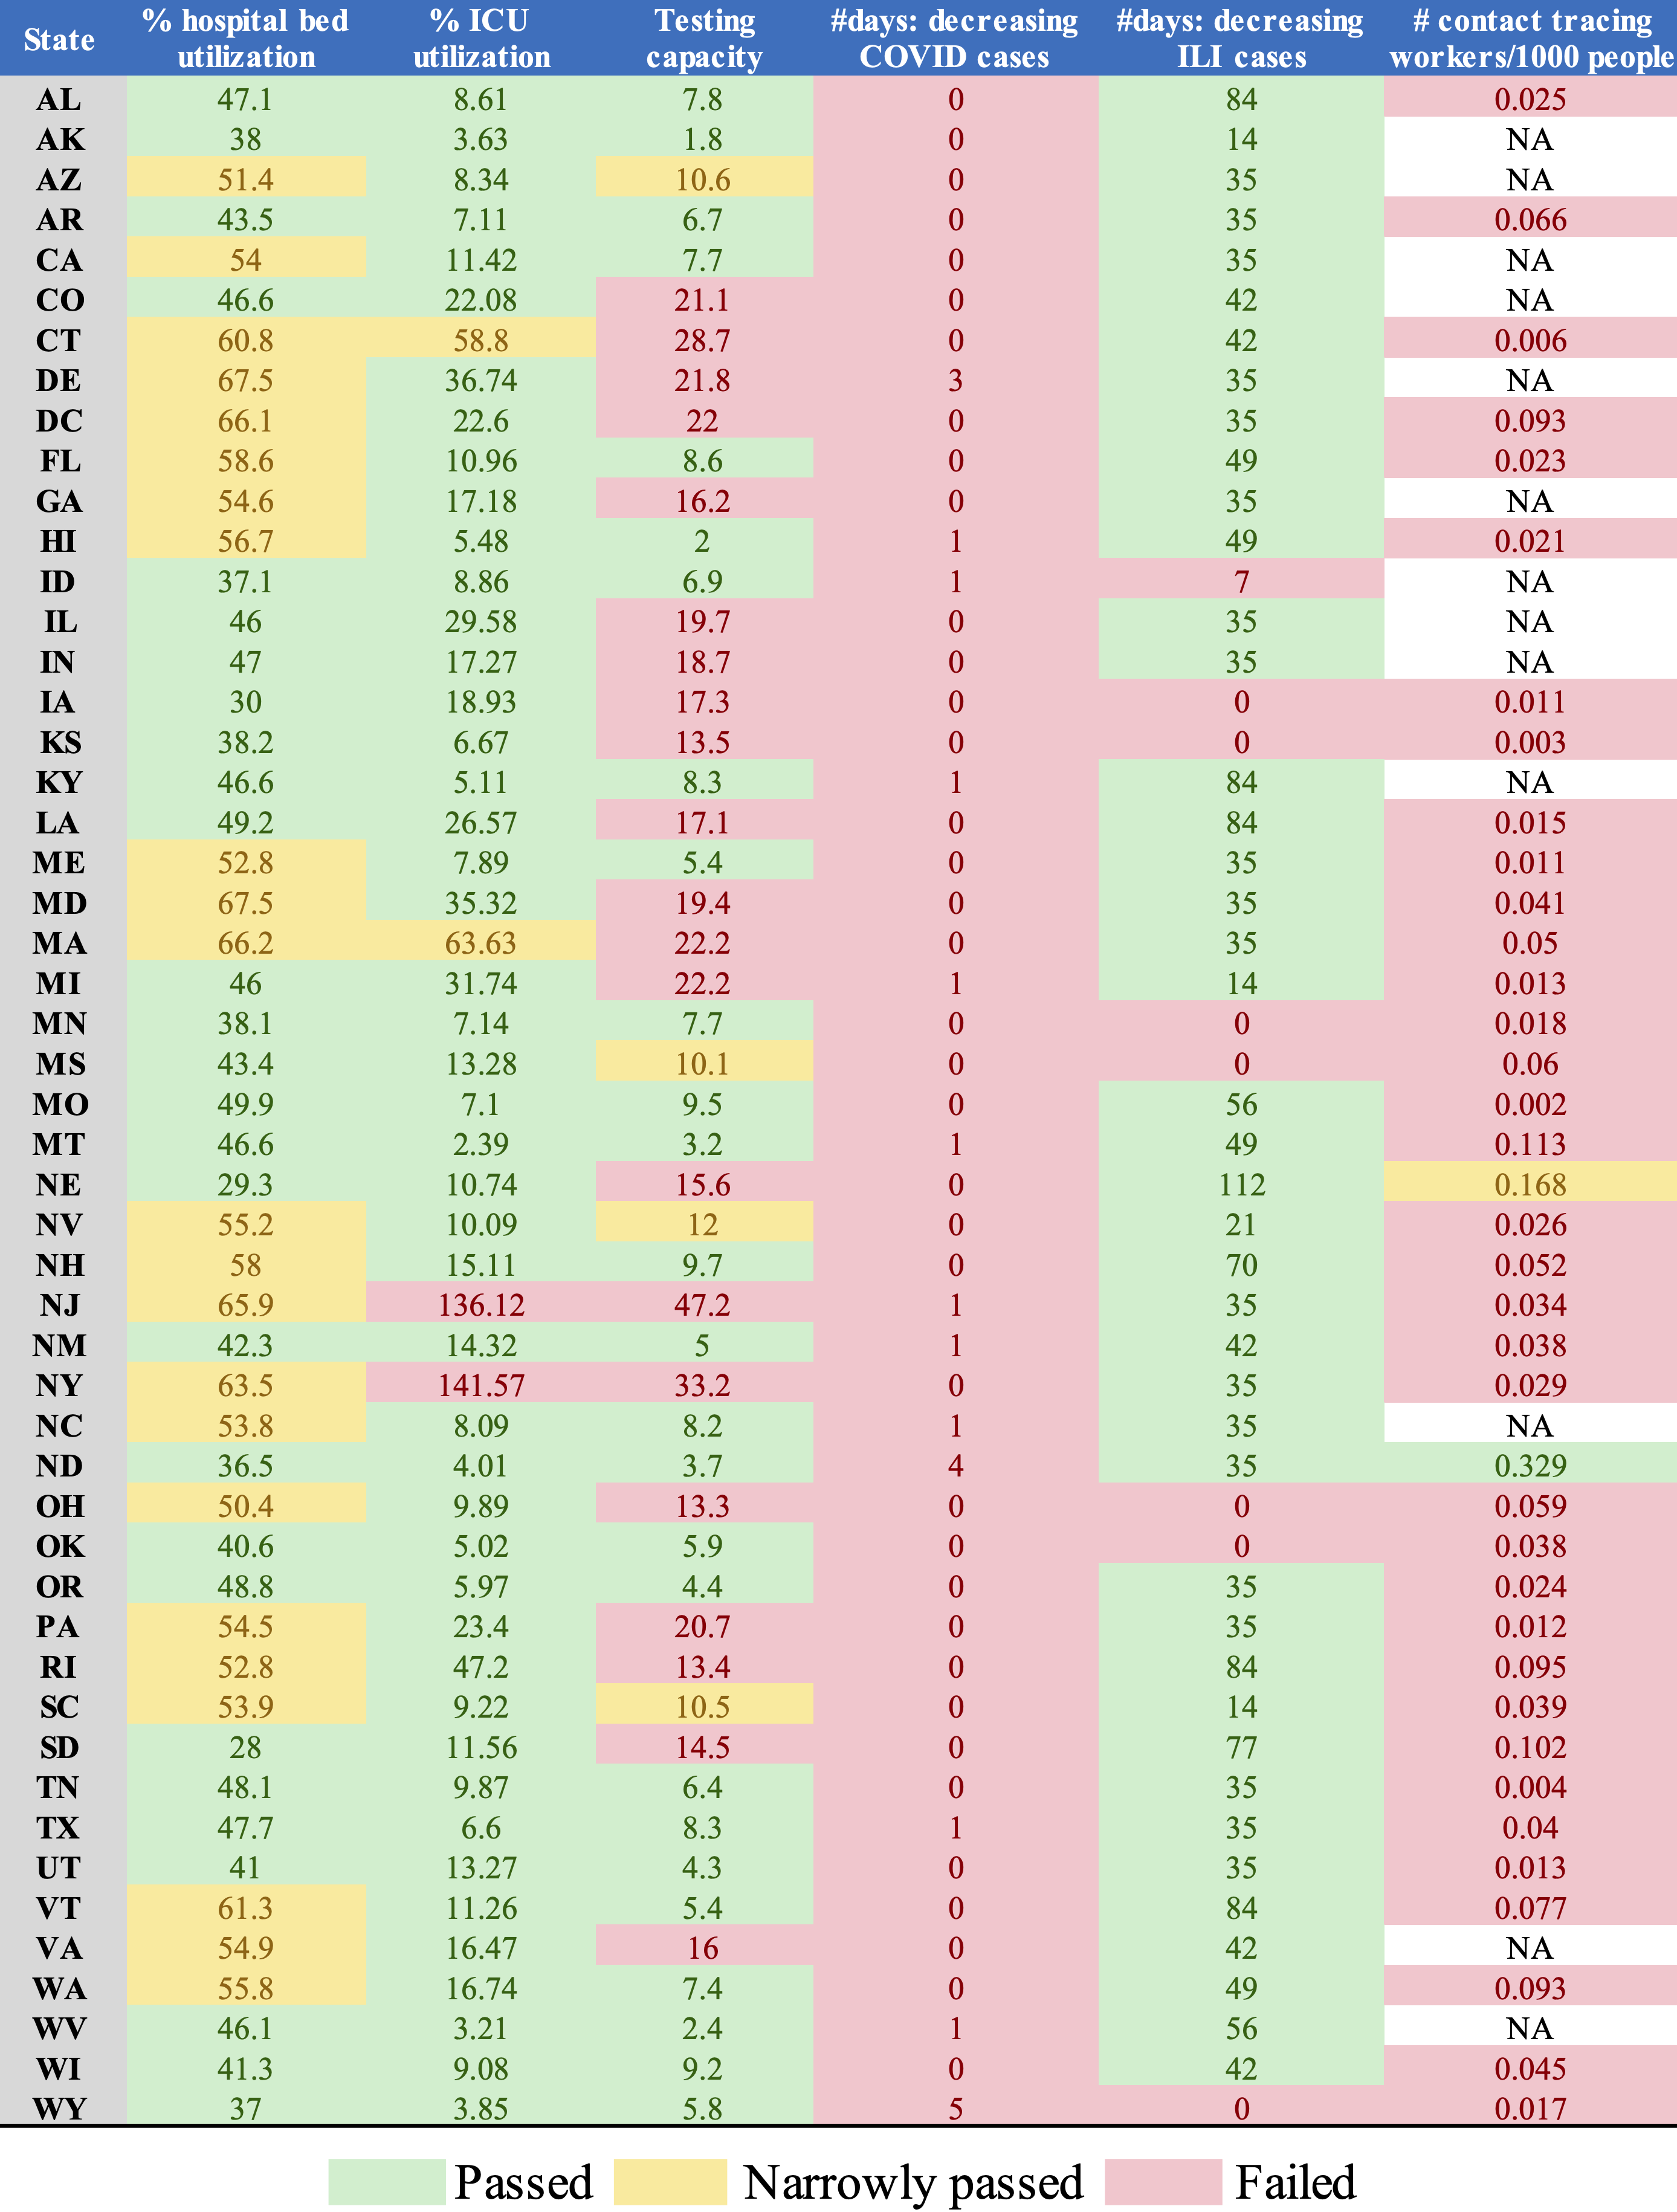
- No state has passed all six public health gating criteria.
- No state has observed more than 14 days of decreasing COVID cases.
- Most states do not have enough contact tracing workers or sufficient technology that can allow their current contact tracing workers to effectively trace all new cases.
- 21 states do not have sufficient testing capacity as shown by high positive test rates.
- All states, except NY and NJ, have unused ICU beds for COVID-19 patients. All states still have unused hospital beds for COVID-19 patients. 23 states have hospital bed utilization above 50% and may consider adding additional hospital beds for reopening.
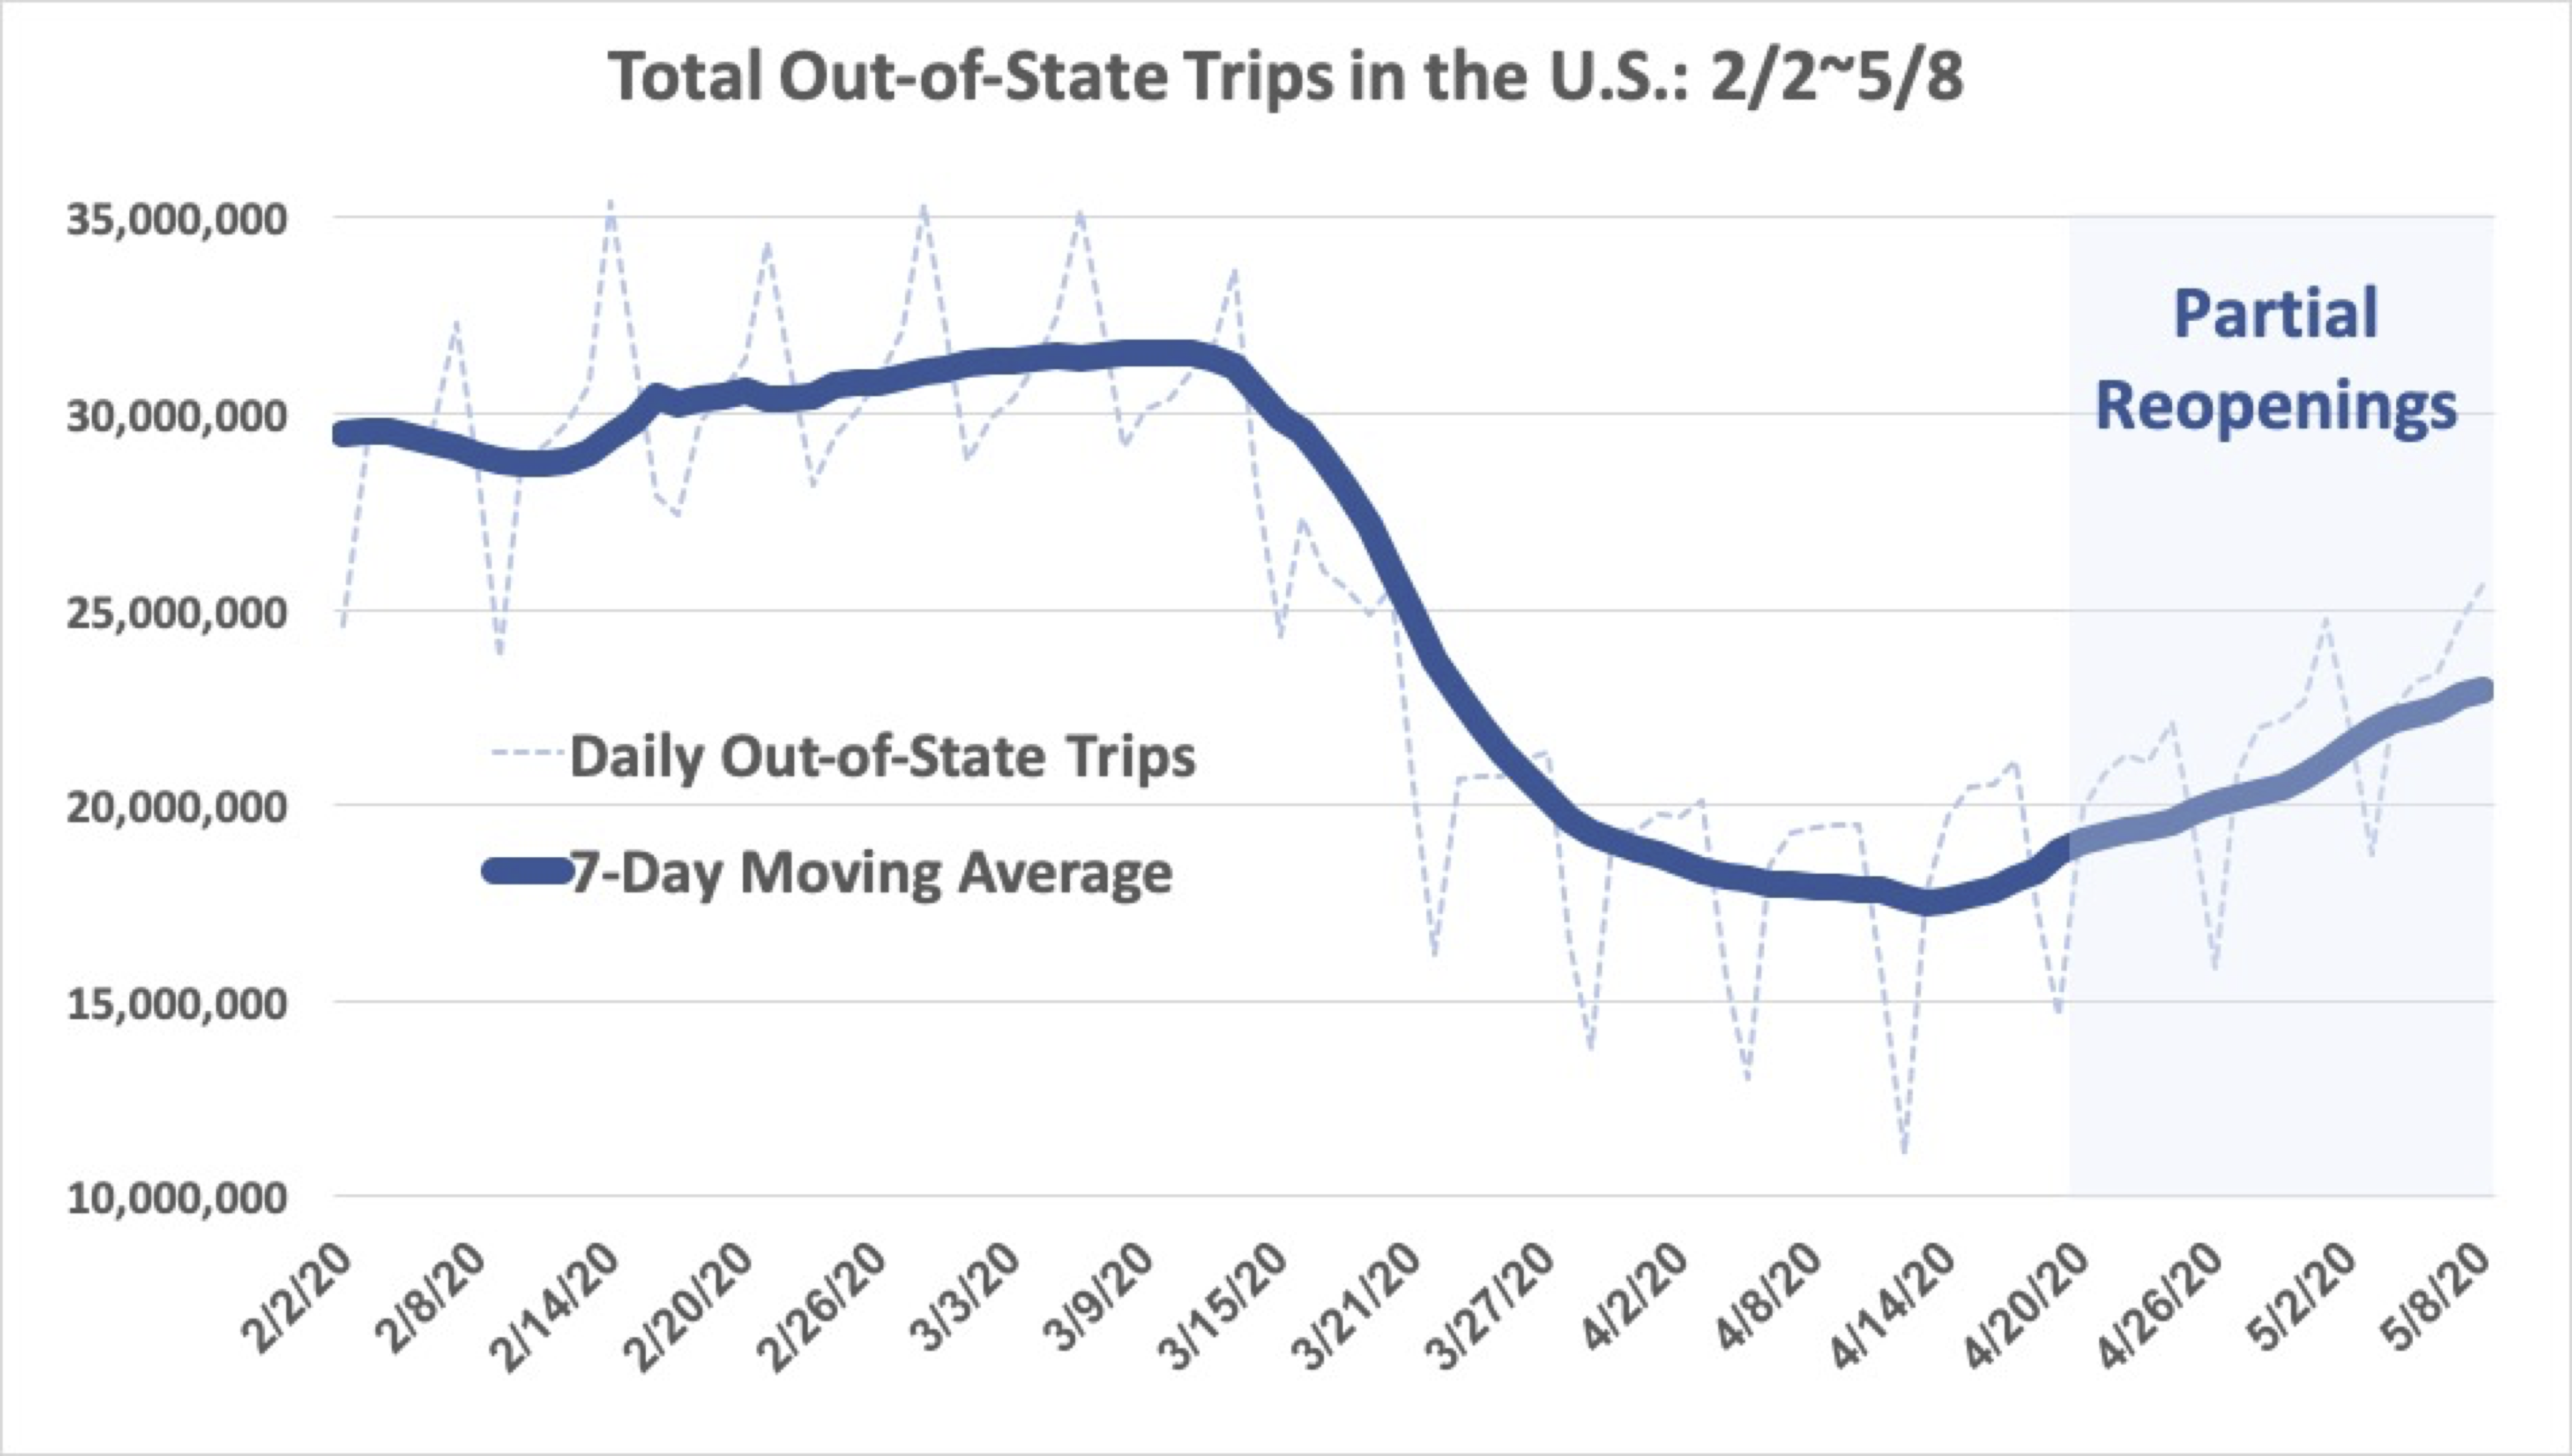
- Partial reopenings have produced 4.6 million more out-of-state trips per day that cross state borders in the U.S., which could cause new outbreaks. Top 10 states with the most increases in out-of-state trips are GA, PA, NC, AL, SC, TN, IL, MD, FL and VA.
- Between 4/23 and 5/8, social distancing index dropped by 13 points nationwide, percentage of people staying home dropped by 19%, number of non-work trips increased by 16%, and distance travelled increased by 21% nationwide. Top 10 states with the most reduction in social distancing behavior are GA, AK, SC, MI, AL, WA, UT, MO, IN, and ID.
MAY 6, 2020: IMPACT OF PARTIAL REOPENINGS ON MOBILITY BEHAVIOR
1. Overall impact of partial reopenings between April 23 and May 1
Between April 23 and May 1, more than a dozen states announced partial reopenings. During the same period, the Social Distancing Index (SDI)—a metric that quantifies compliance with guidelines intended to contain the spread of COVID-19—dropped by 12 points nationwide. During the same period, % people staying home decreased from 31% to 26%, which was a 17% drop nationwide. Number of non-work trips and travel distance per person both increased by 17% nationwide.
All ten states with the sharpest reductions in social distancing are states that have announced partial reopenings. Of the ten states with the lowest reductions, nine are still under lockdown. New York and all New England states have seen least reduction in social distancing.
Several states, including Alabama, Georgia, Mississippi, Tennessee and Indiana, the SDI dropped by more than 20 points, and percentage of people staying home decreased by more than 30% between April 23 and May 1. A similar drop was recorded in Michigan, which has seen widely-publicized protests against COVID-19 restrictions. On April 24, Governor Gretchen Wilmer extended the state’s stay-at-home order, but allowed some businesses to reopen. Travel distances and the number of non-work-related trips have both increased by 20% across states that had partially reopened as of May 1 and by 14% in states still under lockdown.
Among all states with partial reopenings by 5/1, SDI decreased by 15 points, 6% fewer people are staying home, non-work trips and travel distance increased by 20%. Among all states still under lockdown by 5/1, SDI decreased by 9 points, 4% fewer people are staying home, non-work trips and travel distance increased by 15%. The large increase in the number of trips cannot be explained by the reopened businesses alone. People are responding to partial reopening by making more trips across the board. The only exception is that work trips have not changed much after reopening.
2. Out-of-state travel to Georgia following its 4/24 partial reopening
The MTI team also analyzed all out-of-state trips to Georgia before and after its partial reopening on 4/24. Its surrounding states either reopened later on 5/1 (e.g., AL) or are still under lockdown (e.g., FL). We compared the number of out-of-state trips going into GA between 4/16 and 4/23 (one week before GA reopening) and between 4/24 and 5/1 (one week after GA reopening).
Following partial reopening in GA, the total out-of-state trips to GA from all across the nation increased from 483,718 trips/day to 546,159 trips/day, a 13% increase.
The states that produced the most out-of-state trips to GA are Alabama, South Carolina, Tennessee, Florida, and North Carolina. Following GA partial reopening on 4/24, out-of-state trips to GA increased by 14%, 12%, 11%, 17%, and 11% from Alabama, South Carolina, Tennessee, Florida, and North Carolina, respectively. Florida has not reopened and showed the highest percentage increase for trips to GA among all states.
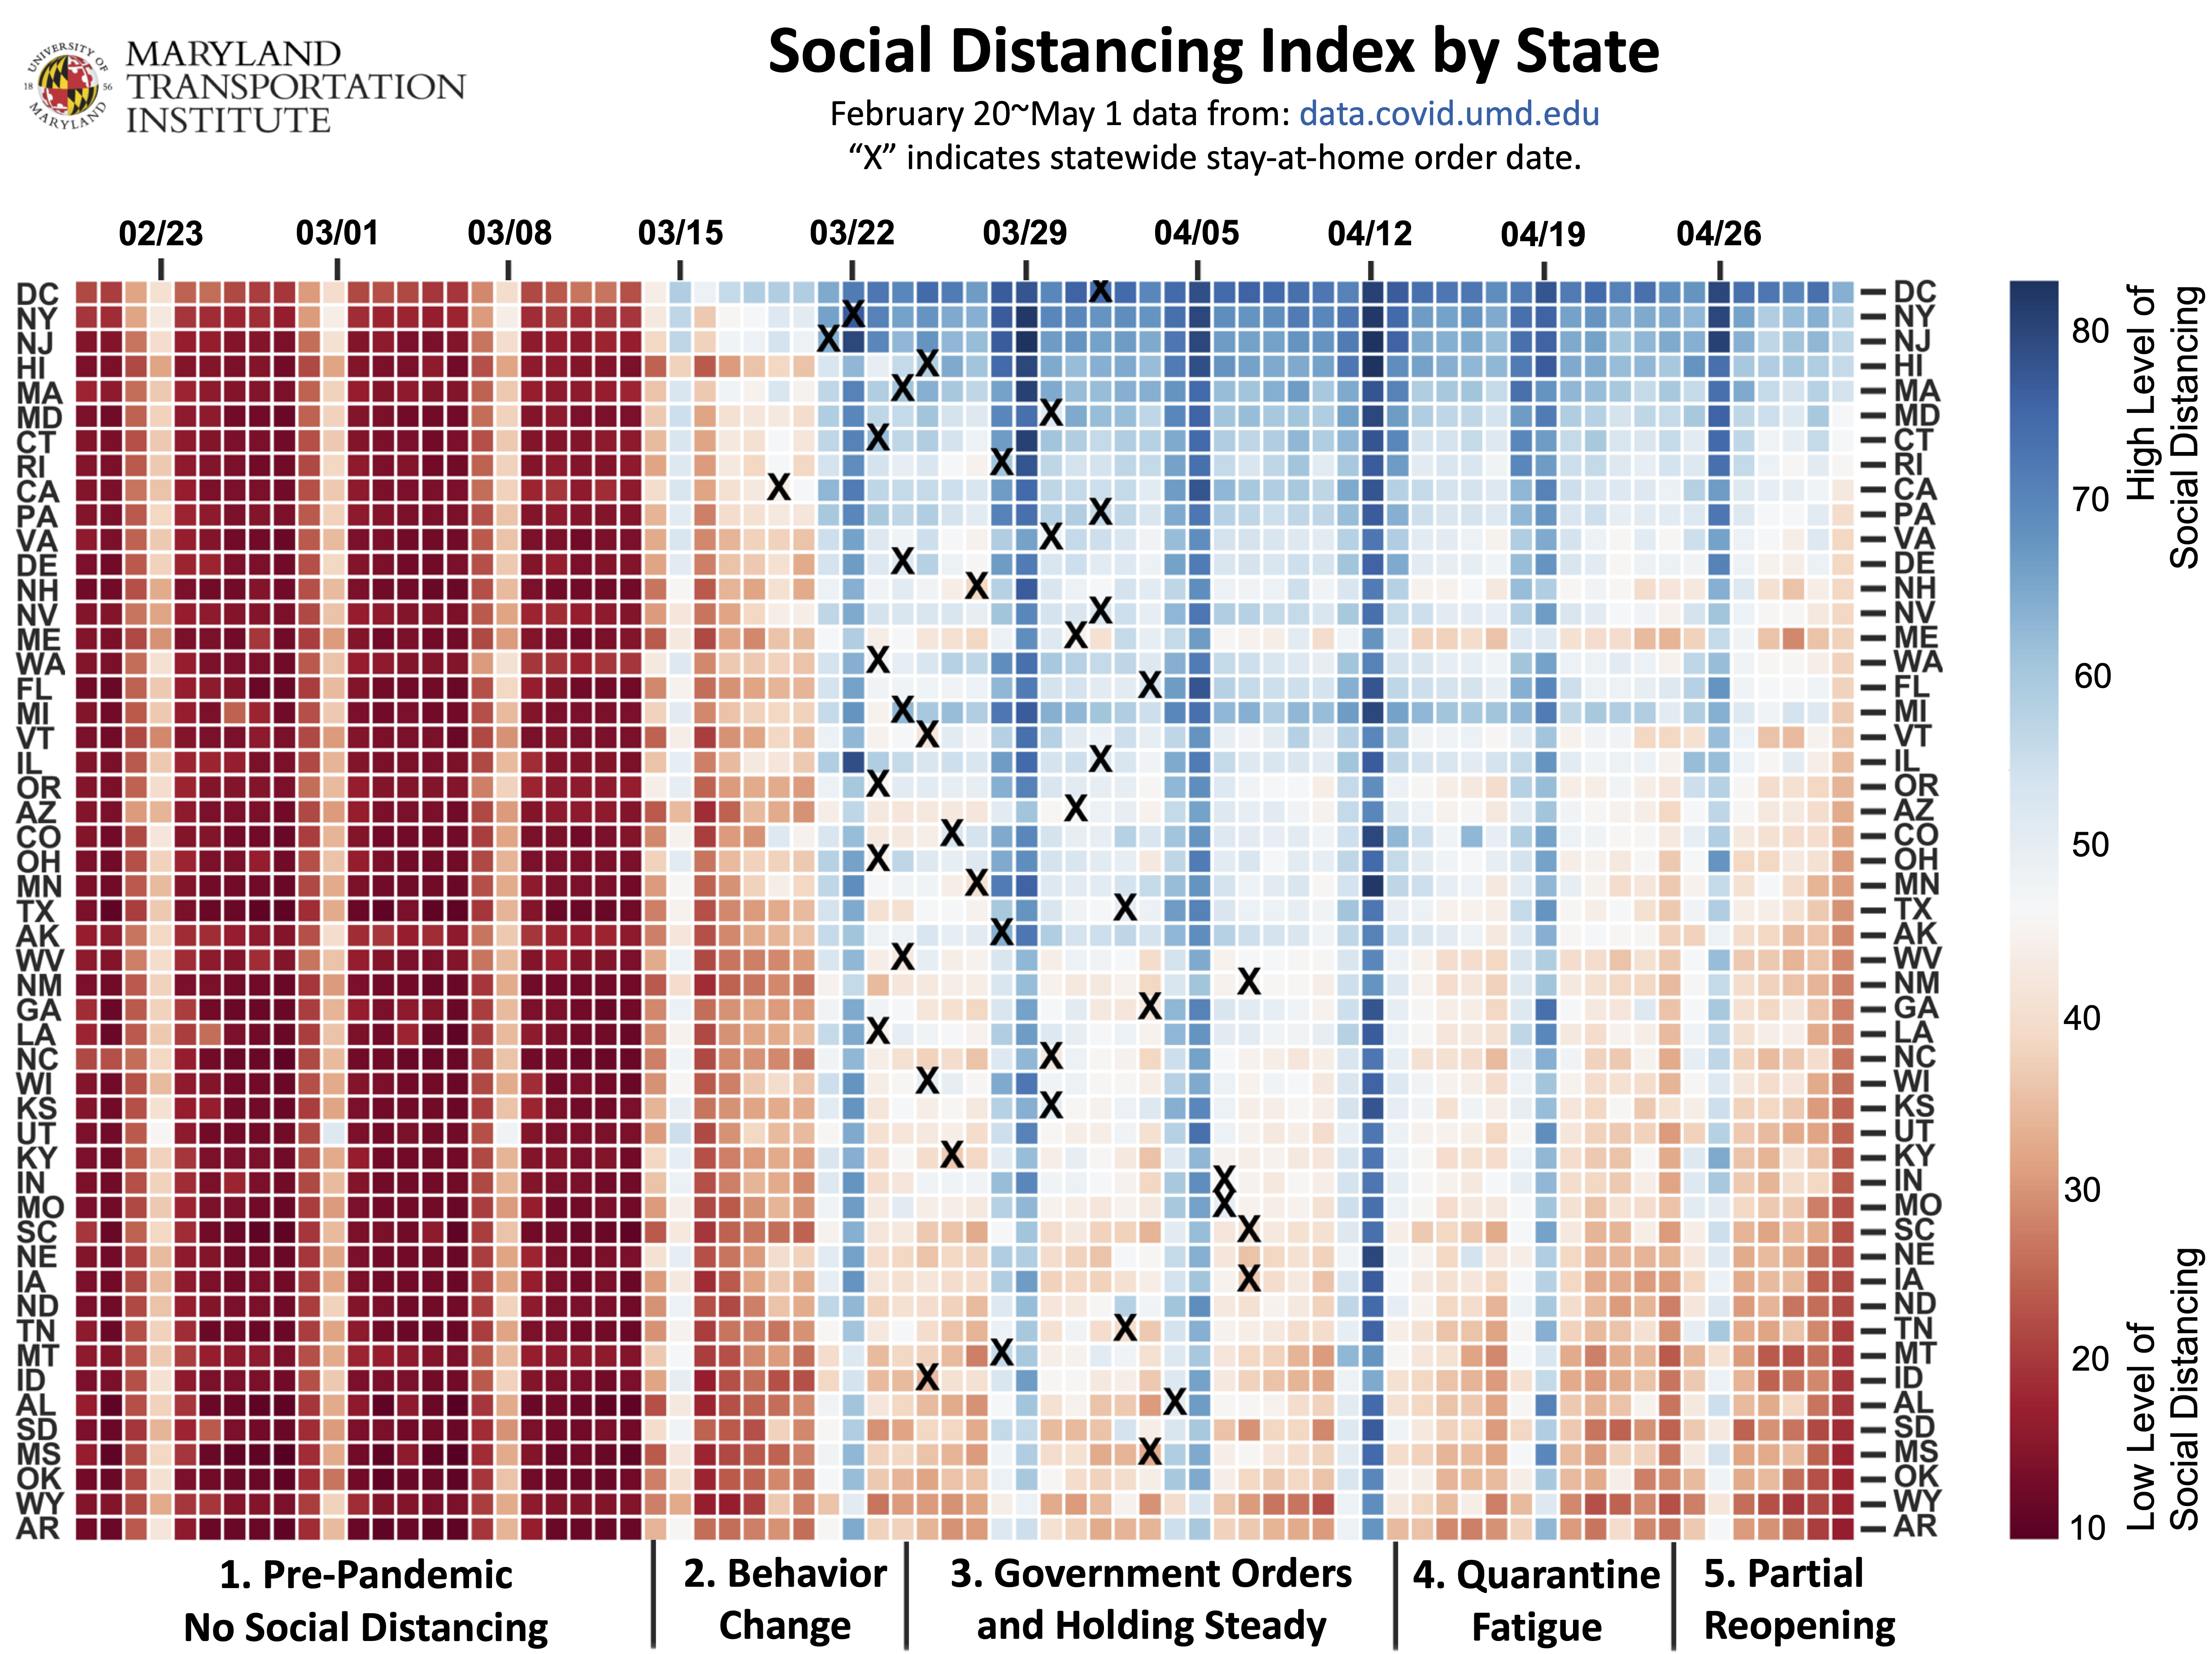
APRIL 28, 2020: FIRST DROP OF SOCIAL DISTANCING BEHAVIOR SINCE OUTBREAK
We are reporting a decline in the Social Distancing Index (SDI), starting on April 14, 2020. The SDI is a metric that records compliance with restrictions and guidelines meant to contain the outbreak. It is the first such decline to be recorded nationwide since the beginning of the COVID-19 pandemic outbreak in the U.S. and comes after successive weeks of the SDI either increasing or holding steady.
Referred to as “quarantine fatigue” in media coverages (see Press page), the trend is widespread: as of April 24, 2020, 48 states have seen a reduction in their SDI, with the largest drops seen in Louisiana (-15), Ohio (-13), Indiana (-12), Vermont (-12), Alabama (-11), Michigan (-11), Mississippi (-11), North Carolina (-11), and Texas (-11). The SDI steadily increased in the United States from March 13 through April 13, rising from 14 to 51. On April 14, however, it began to decline. Week-on-week comparisons show a 3-point drop between April 11-17 and the previous week. And the trend has continued, with a further 4-point drop between April 18-24. Nationwide, the index now stands at 44.
The number of work trips has not changed, and the declining SDI is caused mostly by fewer people staying home, more non-work trips, more out-of-state and out-of-county trips, and longer travel distances.
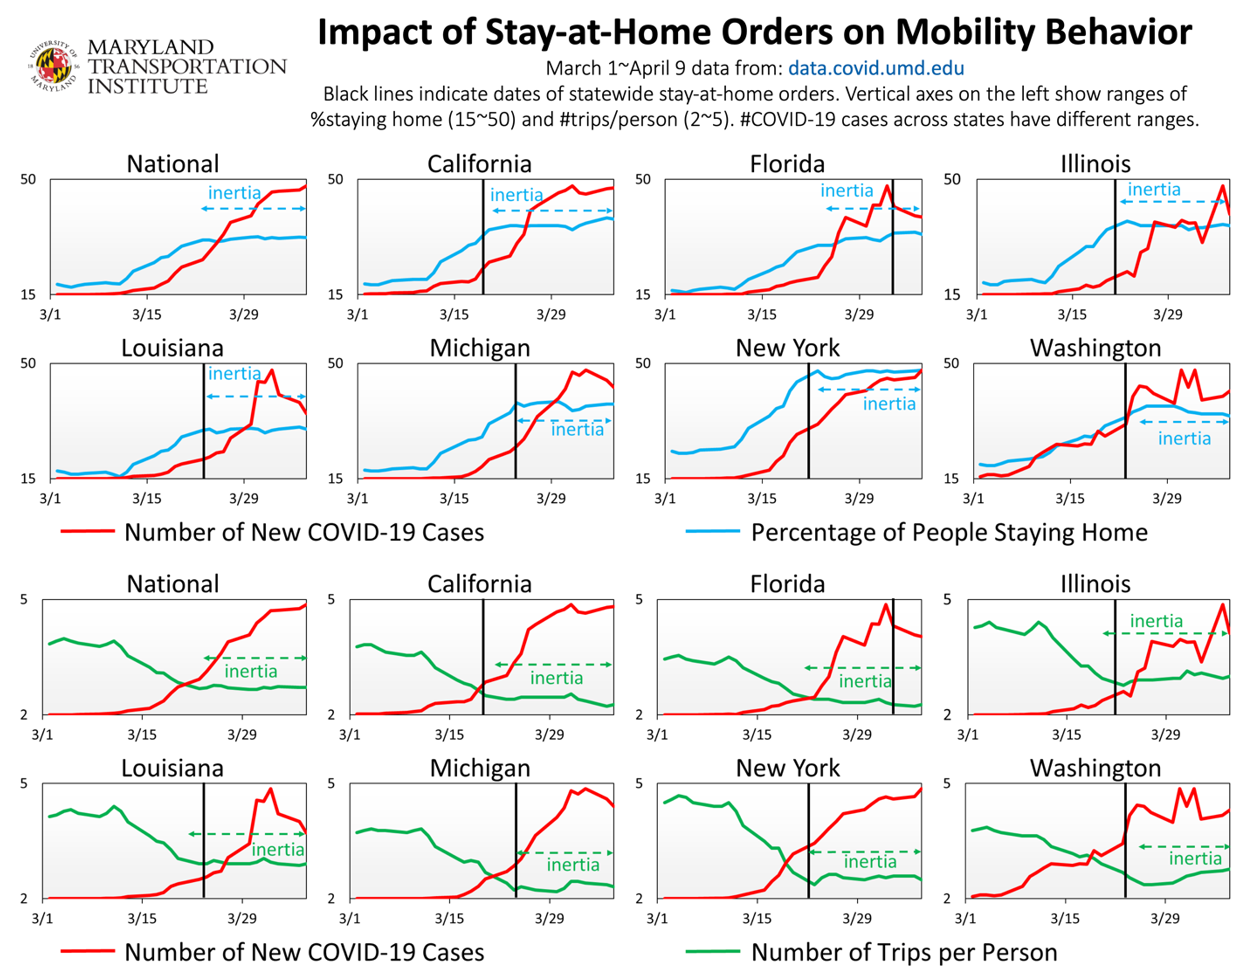
APRIL 10, 2020: COVID-19’S IMPACT ON MOBILITY BEHAVIOR (March 1~April 10) AND EFFECTIVENESS OF STAY-AT-HOME ORDERS
1. Highlight: “Social Distancing Inertia” is a big issue all across the nation
As soon as COVID-19 cases first began to appear in significant numbers in a state or county (i.e., early to mid-March), social distancing measures (index, %staying home, #trips per person, trip distance, out-of-town trips, etc.) began to improve quickly without mandatory government social distancing orders. Those who wanted and were able to limit their interactions with others quickly adopted social distancing practices.
However, after about two weeks into the pandemic (mid to late-March), social distancing measures stopped improving despite skyrocketing COVID-19 case numbers and government stay-at-home orders thus experiencing “Social Distancing Inertia.” For instance, the percentage of people staying home nationwide rapidly increased from 20% to 35% in the week of March 15 at the onset of COVID-19 and then has stagnated at 35% for three weeks as of April 10.
Government advisories and stay-at-home orders have not accomplished expected change in mobility behavior according to our data analysis. Those who are able to adopt social distancing practices have already done so before government intervention. Those who cannot or do not want to stay at home show significant behavior inertia and render government stay-at-home orders much less effective than expected. The average increase of percentage of people staying at home one week after the order compared to one week before the order is just 4.3 percentage points.
2. Policy Recommendations and Advice to the General Public
Government agencies should seek to further improve the effectiveness of social distancing and stay-at-home orders by educating the general public, increasing enforcement, working with employers and communities, and supporting vulnerable populations who may encounter challenges in meeting social distancing requirements. Government stay-at-home orders were issued too late and have accomplished much less than expected results in terms of behavior changes. Individuals have reduced trip distance due to stay-at-home orders, but almost two thirds of the national population are still making trips more than one mile away from home daily. Without strengthening measures, the actual impact of staying-at-home orders on mobility behavior and COVID-19 cases will remain suboptimal. The general public should obey stay-at-home orders and further limit their travel for the most essential needs only.
3. Detailed Research Findings
Stay-at-home analysis
A person is considered staying at home if the person makes no trip longer than one mile away from home. The District of Columbia has the highest percentage of people staying at home in the nation. That percentage increased from 27% to 54% within two weeks in mid-March but then stagnated at 56% in the most recent two weeks, even with a stay-at-home order imposed. District of Columbia is followed by New York (49%), New Jersey (45%), Massachusetts (42%), and Maryland (40%). States with the lowest percentage of people staying at home are Arkansas (26%), South Carolina (27%), Mississippi (27%), Alaska (28%), and Wyoming (28%). In comparison, the average percentage of people staying at home before the pandemic is 20% nationwide.
Five of the top ten counties in terms of percentage of population staying at home during the week of April 6 are in the State of New York. These counties are New York County/Manhattan (69%), Kings County/Brooklyn (62%), Bronx County (61%), Queens County (59%), and Richmond County/Staten Island (52%). Two of the counties are in the state of New Jersey, Hudson County (56%) and Bergen County (52%). The other three are Arlington County, VA (57%), San Francisco County, CA (55%), and District of Columbia (54%).
Effectiveness of government stay-at-home orders
Stay-at-home orders have shown positive but much-less-than-expected results in increasing the percentage of people staying at home and reducing number of trips. The highest increase in the percentage of people staying at home during the week after a statewide order in comparison to the week before the order belongs to New Jersey (13%), followed by New York (11%), Illinois (11%), California (11%), and Michigan (10%). The lowest belongs to Kentucky (1.2%), Maine (0.7%), South Carolina (-0.2%; a negative value indicates a decrease in % staying home after order), Pennsylvania (-0.9%), and Missouri (-1.4%). The average percentage point increase of people staying at home among all the states that issued an order is 4.3% (one week after order vs. one week before order).
On average, states with a statewide stay-at-home order as of April 10 show about a 5.6 percentage higher increase in percentage of people staying at home between the first two weeks of February and the week of April 6, in comparison with the states that did not have stay-at-home order at that time.
Stay-at-home orders have shown positive effects in encouraging people to travel shorter distances. Miles traveled per person after a statewide order in comparison to the week before the order declined by 9.7 miles in Illinois, followed by California (9 miles), New Jersey (8.9 miles), Hawaii (8.5 miles) and New York (8.5 miles). The lowest declines in miles traveled per person following stay-at-home orders are observed in Missouri (-1.9 miles, so actually an increase), South Carolina (-0.9), Pennsylvania (0.3 mile), District of Columbia (1.1 miles) and Texas (1.3 miles). On average, stay-at-home orders have reduced miles traveled per person from 27.1 to 22.6 by 4.5 miles per person.
On average, states with a statewide stay-at-home order as of April 10 show 7.1 miles of additional decrease in miles traveled per person between the first two weeks of February and the week of April 6, in comparison with the states that did not have stay-at-home order as of April 10.
Trip rate analysis between early February and the week of April 6
The total number of trips has dropped 22% nationwide. The average number of trips per person per day, including all trip purposes, decreased from 3.4 to 2.6.
Among all trips for the week of April 6, less than 14% are work trips with the majority of the trips being for non-work purposes. The share of work trips before the pandemic was 14.6%.
District of Columbia (0.61), New York (0.31), Massachusetts (0.25), Illinois (0.23) and New Jersey (0.22) had the largest drop in average number of work trips per person per day. New York (0.96), New Jersey (0.92), Massachusetts (0.90), Maryland (0.79) and California (0.77) had the largest drops in average number of non-work trips per person per day. 34% of American workers started working from home due to COVID-19, based on change in the total number of work trips and number of new unemployment claims.
Inter-county trip share was 29% of all trips before COVID-19 and has only dropped to 25% nationwide in the most recent week. There are still a large portion of trips that cross county borders.